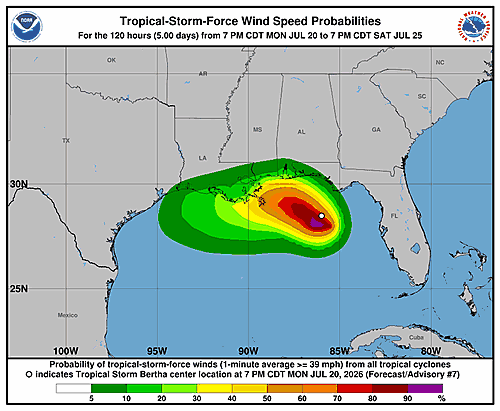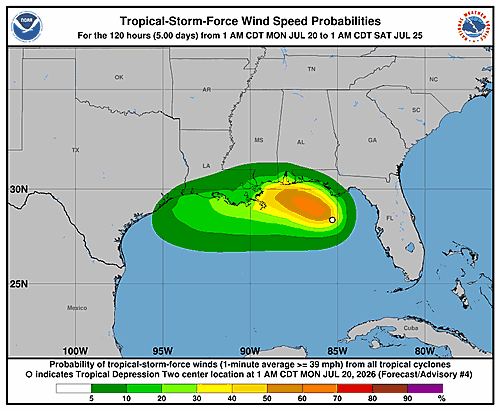

The National Hurricane Center has issued updated graphical information for Tropical Depression Two, tracking the system’s potential wind impacts across a 120-hour forecast window.
The graphics depict the probability of 34-knot wind speeds affecting different areas as the tropical depression continues to develop. These probability maps are a key tool used by forecasters and emergency managers to assess where tropical storm-force winds may occur.
The wind speed probability graphics were last updated Monday, July 20, 2026, at 9:22 a.m. GMT. Residents in potentially affected areas are encouraged to monitor the latest updates from the National Hurricane Center as the system evolves.